Tutorial: Basic Planning and Learning
Tutorials > Basic Planning and Learning > Part 6
- Introduction
- Creating the class shell
- Initializing the data members
- Setting up a result visualizer
- Planning with BFS
- Planning with DFS
- Planning with A*
- Planning with Value Iteration
- Learning with Q-Learning
- Learning with Sarsa(λ)
- Live Visualization
- Value Function and Policy Visualization
- Experimenter Tools and Performance Plotting
- Conclusion
Experimenter Tools and Performance Plotting
In the previous section you learned how to use an EnvironmentObserver to perform live visualization of the agent in the state space as it was learning. In this section we will make use another EnvironmentObserver called PerformancePlotter to record a learning algorithm's performance and compare it to another learning algorithm. The PerformacnePlotter has a lot of powerful tools to display lots of important experimental results. To streamline the construction process, we will make use of the LearningAlgorithmExperimenter class, which is convenient for comparing the performance of multiple learning algorithms over many trials. If you'd prefer to run your own experiment using a different design flow, however, you could make use of the PerformancePlotter directly yourself.
To demonstrate the LearningAlgorithmExperimenter, we will compare the learning performance of a Q-learning algorithm with the performance of a SARSA(λ) algorithm. To make the results a bit more interesting to visualize, we will also use a different reward function than we have been that returns a reward of 5 when the goal is reached and -0.1 for every other step.
Lets then begin by adding a new method to our BasicBehavior class to call to test the experimenter tools. Inside the method, we will change our SimulateEnvironment object's reward function to an instance of the GoalBasedRF which takes a StateConditionTest object to specify goal conditions (which we have already set up previously in the tutorial for our search algorithms like BFS), a goal reward, and a default reward for all non-goal states.
public void experimenterAndPlotter(){

	//different reward function for more interesting results
	((SimulatedEnvironment)env).setRf(new GoalBasedRF(this.goalCondition, 5.0, -0.1));


}
For the LearningAlgorithmExperimenter to report an average performance of each algorithm, it will test the algorithm over multiple trials. Therefore, at the start of each trial a clean agent instance of the algorithm without knowledge of any of the previous trials must be generated. To easily get a clean version of each agent, the LearningAlgorithmExperimenter will request a sequence of LearningAgentFactory objects that can be used to generate a clean version of each agent on demand. In the following code, we create a LearningAgentFactory for a Q-learning algorithm and a SARSA(λ) algorithm.
/**
 * Create factories for Q-learning agent and SARSA agent to compare
 */

LearningAgentFactory qLearningFactory = new LearningAgentFactory() {
	@Override
	public String getAgentName() {
		return "Q-Learning";
	}

	@Override
	public LearningAgent generateAgent() {
		return new QLearning(domain, 0.99, hashingFactory, 0.3, 0.1);
	}
};

LearningAgentFactory sarsaLearningFactory = new LearningAgentFactory() {
	@Override
	public String getAgentName() {
		return "SARSA";
	}

	@Override
	public LearningAgent generateAgent() {
		return new SarsaLam(domain, 0.99, hashingFactory, 0.0, 0.1, 1.);
	}
};
Note that the factory also requires a getAgentName() method to be implemented. The LearningAgentExperimenter class will use this name to label the results of each learning algorithm's performance.
We are just about ready to create our experimenter, but first we will need to decide how many trials we want to test, the length of the trials, and what performance data we want to plot. There are six possible performance metrics we could plot:
- cumulative reward per step,
- cumulative reward per episode,
- average reward per episode,
- median reward per episode,
- cumulative steps per episode, and
- steps per episode.
Furthermore, we could also have our plotter display the results from the most recent trial only, the average performance across all trials, or both. For this tutorial, we will plot both the most recent trial and average trial performance for the cumulative steps per episode and the average reward per episode. We will also test the algorithms for 10 trials that last 100 episodes each. The below code will create our experimenter, start it, and also save all the data for all six metrics to CSV files.
LearningAlgorithmExperimenter exp = new LearningAlgorithmExperimenter(env, 10, 100,
									qLearningFactory, sarsaLearningFactory);
exp.setUpPlottingConfiguration(500, 250, 2, 1000,
		TrialMode.MOSTRECENTANDAVERAGE,
		PerformanceMetric.CUMULATIVESTEPSPEREPISODE,
		PerformanceMetric.AVERAGEEPISODEREWARD);

exp.startExperiment();
exp.writeStepAndEpisodeDataToCSV("expData");
Note that in the constructor, the LearningAgent factories are the last parameters, of which a variable number of factories could be provided; we could have tested just one agent, or we could have tested many more, but there should naturally always be at least one LearningAgentFactory provided.
The other important part of the code is the setUpPlottingConfiguration method, which is used to define what results are plotted and how they are displayed. The first four parameters specify a plot's width and height, the number of columns of plots, and the maximum window height. In this case, plots are set to be 500x200, with two columns of plots. Plots are placed columns first, wrapping down to a new row as needed. The window size will be scaled to the width of plots times the number of columns; the height will scale to the height of the plots times the number of rows, unless that height is greater than the maximum window height, in which case the plots will be placed in a scroll view. The next parameter specifies whether to show plots for only the most recent trial, the average performance over all trials, or both. We have selected to show both. The remaining parameters are variable in size and specify which performance metrics will be plotted. The order of the performance metrics provided also dictates the order that the plots will fill the window (again, filling columns first).
The startExperiment method begins the experiment which will run all trials for all learning algorithms provided.
Once you point our BasicBevhavior main method to the new method we've created and run the code, A GUI should appear with the plots requested, displaying the performance as it is available. When the experiment is complete, you should be left with an image like the below.
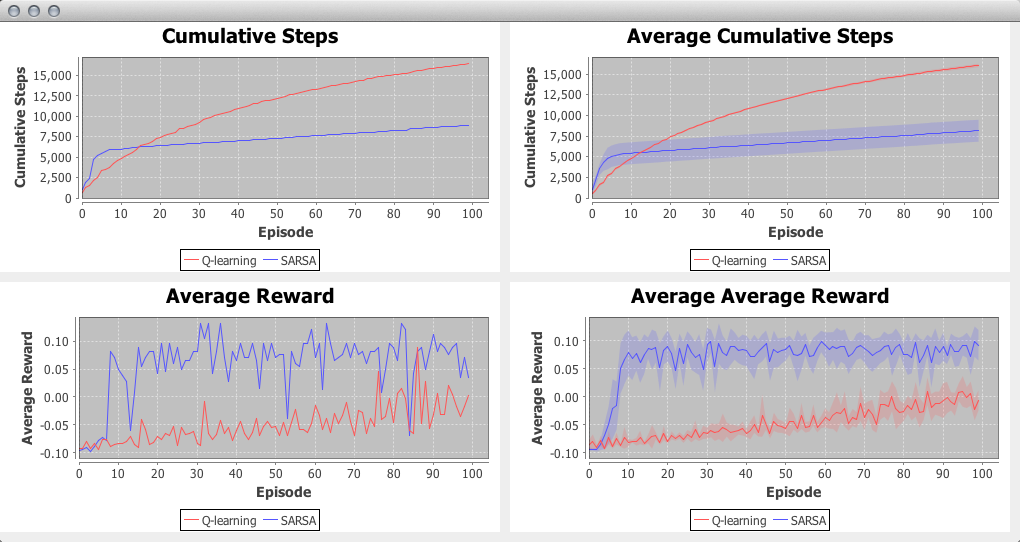
In the trial average plots, you'll note that a translucent filled area around each of the curves is present. This filled area shows the 95% confidence interval. You can change the significance level used before running the experiment using the setPlotCISignificance method.
Note that these plots are not static and you can interact with them. If you click drag in a region, it will cause the plot to zoom into the selected area. If you right click, you'll find a number of other options that you can set, including changing the labels. Another important feature you'll see from the contextual menu is an option to save plot image to disk.
Since we also told the LearningAlgorithmExperimenter object to save the data to csv files, you should find two files that it created: expDataSteps.csv and expDataEpisodes.csv. The first contains all trial data for the cumulative reward per step metric. The latter contains all of the episode-wise metric data (even for the metrics that we did not plot). These files will make interacting with the data in another program, such as R, convenient.
Conclusion
This ends our tutorial on implementing basic planning and learning algorithms in BURLAP. There are other planning and learning algorithms in BURLAP, but hopefully this tutorial has explained the core concepts well enough that you should be able to try different algorithms easily. As a future exercise, we encourage you to try just that within this code you've created! The complete set of code that we wrote in this tutorial is shown below for your convenience.
The full code is also in the BURLAP code libary under the examples package.
import burlap.behavior.policy.GreedyQPolicy;
import burlap.behavior.policy.Policy;
import burlap.behavior.singleagent.EpisodeAnalysis;
import burlap.behavior.singleagent.auxiliary.EpisodeSequenceVisualizer;
import burlap.behavior.singleagent.auxiliary.StateReachability;
import burlap.behavior.singleagent.auxiliary.performance.LearningAlgorithmExperimenter;
import burlap.behavior.singleagent.auxiliary.performance.PerformanceMetric;
import burlap.behavior.singleagent.auxiliary.performance.TrialMode;
import burlap.behavior.singleagent.auxiliary.valuefunctionvis.ValueFunctionVisualizerGUI;
import burlap.behavior.singleagent.auxiliary.valuefunctionvis.common.ArrowActionGlyph;
import burlap.behavior.singleagent.auxiliary.valuefunctionvis.common.LandmarkColorBlendInterpolation;
import burlap.behavior.singleagent.auxiliary.valuefunctionvis.common.PolicyGlyphPainter2D;
import burlap.behavior.singleagent.auxiliary.valuefunctionvis.common.StateValuePainter2D;
import burlap.behavior.singleagent.learning.LearningAgent;
import burlap.behavior.singleagent.learning.LearningAgentFactory;
import burlap.behavior.singleagent.learning.tdmethods.QLearning;
import burlap.behavior.singleagent.learning.tdmethods.SarsaLam;
import burlap.behavior.singleagent.planning.Planner;
import burlap.behavior.singleagent.planning.deterministic.DeterministicPlanner;
import burlap.behavior.singleagent.planning.deterministic.informed.Heuristic;
import burlap.behavior.singleagent.planning.deterministic.informed.astar.AStar;
import burlap.behavior.singleagent.planning.deterministic.uninformed.bfs.BFS;
import burlap.behavior.singleagent.planning.deterministic.uninformed.dfs.DFS;
import burlap.behavior.singleagent.planning.stochastic.valueiteration.ValueIteration;
import burlap.behavior.valuefunction.QFunction;
import burlap.behavior.valuefunction.ValueFunction;
import burlap.domain.singleagent.gridworld.GridWorldDomain;
import burlap.domain.singleagent.gridworld.GridWorldVisualizer;
import burlap.oomdp.auxiliary.common.SinglePFTF;
import burlap.oomdp.auxiliary.stateconditiontest.StateConditionTest;
import burlap.oomdp.auxiliary.stateconditiontest.TFGoalCondition;
import burlap.oomdp.core.Domain;
import burlap.oomdp.core.TerminalFunction;
import burlap.oomdp.core.objects.ObjectInstance;
import burlap.oomdp.core.states.State;
import burlap.oomdp.singleagent.RewardFunction;
import burlap.oomdp.singleagent.SADomain;
import burlap.oomdp.singleagent.common.GoalBasedRF;
import burlap.oomdp.singleagent.common.UniformCostRF;
import burlap.oomdp.singleagent.common.VisualActionObserver;
import burlap.oomdp.singleagent.environment.Environment;
import burlap.oomdp.singleagent.environment.EnvironmentServer;
import burlap.oomdp.singleagent.environment.SimulatedEnvironment;
import burlap.oomdp.statehashing.HashableStateFactory;
import burlap.oomdp.statehashing.SimpleHashableStateFactory;
import burlap.oomdp.visualizer.Visualizer;

import java.awt.*;
import java.util.List;


public class BasicBehavior {

	GridWorldDomain gwdg;
	Domain domain;
	RewardFunction rf;
	TerminalFunction tf;
	StateConditionTest goalCondition;
	State initialState;
	HashableStateFactory hashingFactory;
	Environment env;


	public BasicBehavior(){
		gwdg = new GridWorldDomain(11, 11);
		gwdg.setMapToFourRooms();
		domain = gwdg.generateDomain();


		rf = new UniformCostRF();
		tf = new SinglePFTF(domain.getPropFunction(GridWorldDomain.PFATLOCATION));
		goalCondition = new TFGoalCondition(tf);

		initialState = GridWorldDomain.getOneAgentNLocationState(domain, 1);
		GridWorldDomain.setAgent(initialState, 0, 0);
		GridWorldDomain.setLocation(initialState, 0, 10, 10);

		hashingFactory = new SimpleHashableStateFactory();

		env = new SimulatedEnvironment(domain, rf, tf, initialState);


		/*
		VisualActionObserver observer = new VisualActionObserver(domain,
									GridWorldVisualizer.getVisualizer(gwdg.getMap()));
		observer.initGUI();
		env = new EnvironmentServer(env, observer);
		//((SADomain)domain).addActionObserverForAllAction(observer);
		*/
	}


	public void visualize(String outputpath){
		Visualizer v = GridWorldVisualizer.getVisualizer(gwdg.getMap());
		new EpisodeSequenceVisualizer(v, domain, outputpath);
	}

	public void BFSExample(String outputPath){

		DeterministicPlanner planner = new BFS(domain, goalCondition, hashingFactory);
		Policy p = planner.planFromState(initialState);
		p.evaluateBehavior(initialState, rf, tf).writeToFile(outputPath + "bfs");

	}

	public void DFSExample(String outputPath){

		DeterministicPlanner planner = new DFS(domain, goalCondition, hashingFactory);
		Policy p = planner.planFromState(initialState);
		p.evaluateBehavior(initialState, rf, tf).writeToFile(outputPath + "dfs");

	}

	public void AStarExample(String outputPath){

		Heuristic mdistHeuristic = new Heuristic() {
			@Override
			public double h(State s) {

				ObjectInstance agent = s.getFirstObjectOfClass(GridWorldDomain.CLASSAGENT);
				ObjectInstance location = s.getFirstObjectOfClass(GridWorldDomain.CLASSLOCATION);

				int ax = agent.getIntValForAttribute(GridWorldDomain.ATTX);
				int ay = agent.getIntValForAttribute(GridWorldDomain.ATTY);

				int lx = location.getIntValForAttribute(GridWorldDomain.ATTX);
				int ly = location.getIntValForAttribute(GridWorldDomain.ATTY);

				double mdist = Math.abs(ax-lx) + Math.abs(ay-ly);

				return -mdist;
			}
		};

		DeterministicPlanner planner = new AStar(domain, rf, goalCondition, hashingFactory, mdistHeuristic);
		Policy p = planner.planFromState(initialState);

		p.evaluateBehavior(initialState, rf, tf).writeToFile(outputPath + "astar");

	}

	public void valueIterationExample(String outputPath){

		Planner planner = new ValueIteration(domain, rf, tf, 0.99, hashingFactory, 0.001, 100);
		Policy p = planner.planFromState(initialState);

		p.evaluateBehavior(initialState, rf, tf).writeToFile(outputPath + "vi");

		//simpleValueFunctionVis((ValueFunction)planner, p);
		manualValueFunctionVis((ValueFunction)planner, p);

	}


	public void qLearningExample(String outputPath){

		LearningAgent agent = new QLearning(domain, 0.99, hashingFactory, 0., 1.);

		//run learning for 50 episodes
		for(int i = 0; i < 50; i++){
			EpisodeAnalysis ea = agent.runLearningEpisode(env);

			ea.writeToFile(outputPath + "ql_" + i);
			System.out.println(i + ": " + ea.maxTimeStep());

			//reset environment for next learning episode
			env.resetEnvironment();
		}

	}


	public void sarsaLearningExample(String outputPath){

		LearningAgent agent = new SarsaLam(domain, 0.99, hashingFactory, 0., 0.5, 0.3);

		//run learning for 50 episodes
		for(int i = 0; i < 50; i++){
			EpisodeAnalysis ea = agent.runLearningEpisode(env);

			ea.writeToFile(outputPath + "sarsa_" + i);
			System.out.println(i + ": " + ea.maxTimeStep());

			//reset environment for next learning episode
			env.resetEnvironment();
		}

	}

	public void simpleValueFunctionVis(ValueFunction valueFunction, Policy p){

		List<State> allStates = StateReachability.getReachableStates(initialState,
									(SADomain)domain, hashingFactory);
		ValueFunctionVisualizerGUI gui = GridWorldDomain.getGridWorldValueFunctionVisualization(
											allStates, valueFunction, p);
		gui.initGUI();

	}

	public void manualValueFunctionVis(ValueFunction valueFunction, Policy p){

		List<State> allStates = StateReachability.getReachableStates(initialState,
									(SADomain)domain, hashingFactory);

		//define color function
		LandmarkColorBlendInterpolation rb = new LandmarkColorBlendInterpolation();
		rb.addNextLandMark(0., Color.RED);
		rb.addNextLandMark(1., Color.BLUE);

		//define a 2D painter of state values, specifying which attributes correspond
		//to the x and y coordinates of the canvas
		StateValuePainter2D svp = new StateValuePainter2D(rb);
		svp.setXYAttByObjectClass(GridWorldDomain.CLASSAGENT, GridWorldDomain.ATTX,
				GridWorldDomain.CLASSAGENT, GridWorldDomain.ATTY);


		//create our ValueFunctionVisualizer that paints for all states
		//using the ValueFunction source and the state value painter we defined
		ValueFunctionVisualizerGUI gui = new ValueFunctionVisualizerGUI(
												allStates, svp, valueFunction);

		//define a policy painter that uses arrow glyphs for each of the grid world actions
		PolicyGlyphPainter2D spp = new PolicyGlyphPainter2D();
		spp.setXYAttByObjectClass(GridWorldDomain.CLASSAGENT, GridWorldDomain.ATTX,
				GridWorldDomain.CLASSAGENT, GridWorldDomain.ATTY);
		spp.setActionNameGlyphPainter(GridWorldDomain.ACTIONNORTH, new ArrowActionGlyph(0));
		spp.setActionNameGlyphPainter(GridWorldDomain.ACTIONSOUTH, new ArrowActionGlyph(1));
		spp.setActionNameGlyphPainter(GridWorldDomain.ACTIONEAST, new ArrowActionGlyph(2));
		spp.setActionNameGlyphPainter(GridWorldDomain.ACTIONWEST, new ArrowActionGlyph(3));
		spp.setRenderStyle(PolicyGlyphPainter2D.PolicyGlyphRenderStyle.DISTSCALED);


		//add our policy renderer to it
		gui.setSpp(spp);
		gui.setPolicy(p);

		//set the background color for places where states are not rendered to grey
		gui.setBgColor(Color.GRAY);

		//start it
		gui.initGUI();


	}


	public void experimentAndPlotter(){

		//different reward function for more interesting results
		((SimulatedEnvironment)env).setRf(new GoalBasedRF(this.goalCondition, 5.0, -0.1));

		/**
		 * Create factories for Q-learning agent and SARSA agent to compare
		 */
		LearningAgentFactory qLearningFactory = new LearningAgentFactory() {
			@Override
			public String getAgentName() {
				return "Q-Learning";
			}

			@Override
			public LearningAgent generateAgent() {
				return new QLearning(domain, 0.99, hashingFactory, 0.3, 0.1);
			}
		};

		LearningAgentFactory sarsaLearningFactory = new LearningAgentFactory() {
			@Override
			public String getAgentName() {
				return "SARSA";
			}

			@Override
			public LearningAgent generateAgent() {
				return new SarsaLam(domain, 0.99, hashingFactory, 0.0, 0.1, 1.);
			}
		};

		LearningAlgorithmExperimenter exp = new LearningAlgorithmExperimenter(env, 10, 100,
												qLearningFactory, sarsaLearningFactory);
		exp.setUpPlottingConfiguration(500, 250, 2, 1000,
				TrialMode.MOSTRECENTANDAVERAGE,
				PerformanceMetric.CUMULATIVESTEPSPEREPISODE,
				PerformanceMetric.AVERAGEEPISODEREWARD);

		exp.startExperiment();
		exp.writeStepAndEpisodeDataToCSV("expData");

	}


	public static void main(String[] args) {

		BasicBehavior example = new BasicBehavior();
		String outputPath = "output/";

		example.BFSExample(outputPath);
		//example.DFSExample(outputPath);
		//example.AStarExample(outputPath);
		//example.valueIterationExample(outputPath);
		//example.qLearningExample(outputPath);
		//example.sarsaLearningExample(outputPath);

		//example.experimentAndPlotter();

		example.visualize(outputPath);

	}


}